In this blog post, we’ll build a tool to read transactions from a CSV file and display the total amounts paid to different sellers in descending order. Along the way, we’ll also provide an overview showing the total income and expenses. This will be an interactive, step-by-step tutorial, and we expect readers to have a solid understanding of React. Additionally, we’ll include three extra exercises for you to practice on your own.
The main motivation behind this idea is that online banking platforms usually just display transactions. Sometimes, they show spending categories, but it’s often not exactly what we need to see where our money is going. Fortunately, most of these platforms offer a CSV export feature, allowing us to download our transactions as a CSV file.
By building an app to read this CSV file with JavaScript, we can conveniently customize the report and analyze our expenses the way we prefer, rather than being limited by how the bank presents the data. The more insights we have into our finances, the better we can manage them.
Our app will do the following things:
- Read a CSV file with transactions.
- Aggregate the transactions into categories.
- Display the results in a table.
We’ll write this app entirely in React, without the need for a back-end server. The CSV files will be read using a library called Papaparse, and the UI components will be provided by Material UI, a state of the art React component library.
So let’s get started!
Gather data
First, we need a CSV file with the transactions. These can be exported from an online banking account, or we can create a new spreadsheet from scratch.
Our spreadsheet needs two columns: the first for the payee or any appropriate description of the expense or income, and the second for the amount charged or added, as shown below.
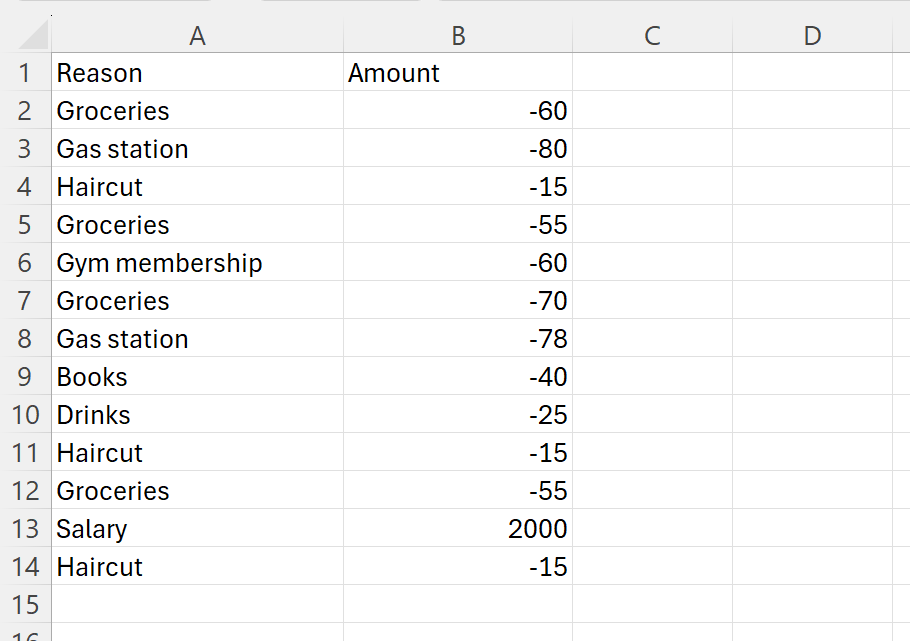
The spreadsheet can be as short as a few lines, like the example above, or contain hundreds of lines covering expenses from the past six months. Papaparse, the CSV parsing library, can efficiently handle large files. All we need is to ensure the spreadsheet has two columns—one for the description and the other for the amount—and save it as a CSV file.
Initialize a new React app
We will use Vite to initialize our app. Vite is a blazing fast front-end build tool, that can be used to quick and easy bootstrap a new project using templates for frameworks like:
- React
- Vue
- Preact
- Svelte
- And more…
In our case we need a React with Typescript app, so we run the following command:
$ npm create vite@latest finance-analyserIn my machine I have npm version 11.
When asked choose React and then Typescript. What we will get as a result is a project structure like the following one depicted bellow:
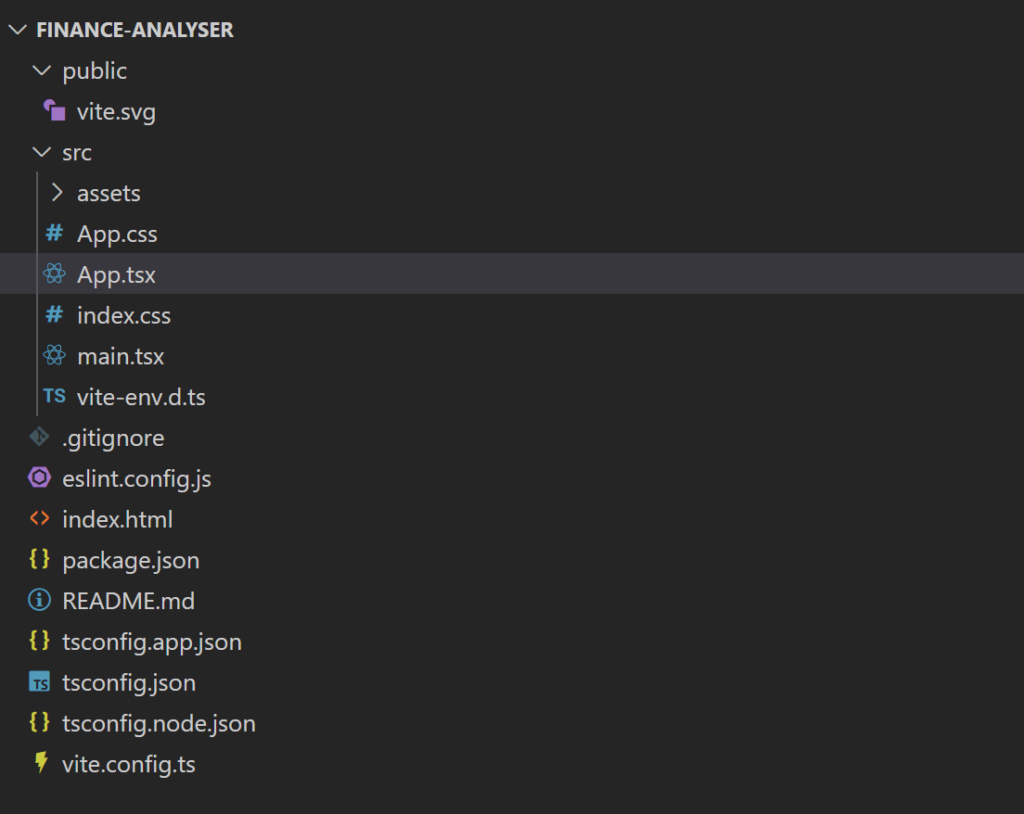
We can change to the created directory, run npm install to install all the initial dependencies and start the app to see the template project, Vite has created for us.
$ cd finance-analyser
$ npn install
$ npm run dev
Before we move on, let’s clear a few things up and delete the template code that we won’t need.
Delete the assets folder, App.css and index.css, then modify the App component to display a simple hello world:
export function App() {
  return <h1>Hello World</h1>;
}
And the index.tsx to just import the App component and mount it, without any CSS:
import { StrictMode } from "react";
import { createRoot } from "react-dom/client";
import { App } from "./App.tsx";

createRoot(document.getElementById("root")!).render(
  <StrictMode>
    <App />
  </StrictMode>
);
With this clear setup we can now initialize a git repository and create the first commit:
$ git init
$ git commit -m 'Initial commit'
Install the required libraries
We will use two additional libraries:
- Papaparse to parse the CSV files
- Material UI for the visual components (an upload button and a table)
The first library is very easy to install:
$ npm install papaparseFor Material UI we will start from the default installation:
$ npm install @mui/material @emotion/react @emotion/styledAnd then add the data grid for the table component and the icons for the icon in the upload button:
$ npm install @mui/x-data-grid @mui/icons-materialIf you used the Typescript template, like we did, you may also consider installing the Papaparse types as a dev dependency:
$ npm install --save-dev @types/papaparseOn our machine the versions that have been installed can be seen bellow:
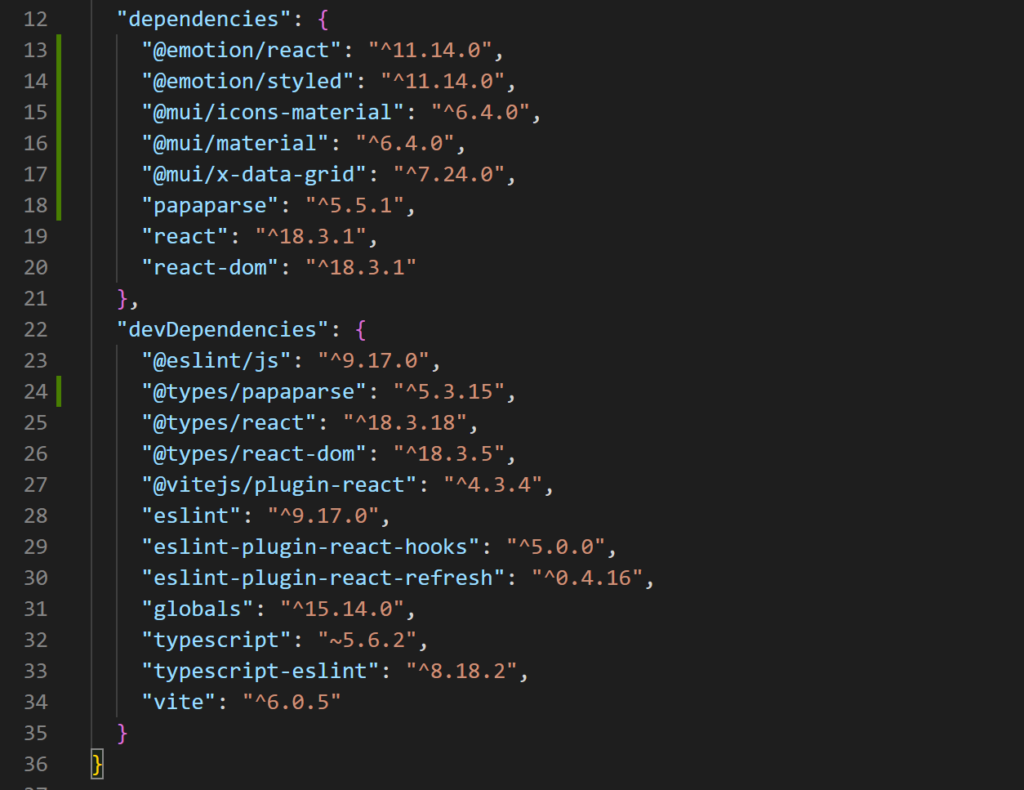
Depending on when you’re reading this, you may have different versions installed. Try to make sure the major versions are the same to avoid any major breaking changes. This means React version 18, MUI version 6, and Papaparse version 5.
It is a good time for our second commit, before we move on to the next step, which is the upload button and CSV react functionality.
$ git add .
$ git commit -m 'Installed dependencies'
Read CSV files
Reading CSV files is easy with the right tools. To start, we’ll need an upload button. For this, we’ll use the MUI button with a hidden file input that only accepts CSV files to handle the upload. The button will be placed inside a container, and we’ll also modify the “Hello World” header to indicate what our app is doing.
After all the above modifications the App.tsx looks like this:
import { Button, Container, CssBaseline, styled } from "@mui/material";
import React from "react";
import CloudUploadIcon from "@mui/icons-material/CloudUpload";

const VisuallyHiddenInput = styled("input")({
  clip: "rect(0 0 0 0)",
  clipPath: "inset(50%)",
  height: 1,
  overflow: "hidden",
  position: "absolute",
  bottom: 0,
  left: 0,
  whiteSpace: "nowrap",
  width: 1,
});

export function App() {
  return (
    <React.Fragment>
      <CssBaseline />
      <Container maxWidth="lg">
        <h1>Upload CSV</h1>
        <Button
          component="label"
          role={undefined}
          variant="contained"
          tabIndex={-1}
          startIcon={<CloudUploadIcon />}
        >
          Upload CSV
          <VisuallyHiddenInput
            type="file"
            accept=".csv"
            multiple={false}
            onChange={() => {
              /* TODO: Add later */
            }}
          />
        </Button>
      </Container>
    </React.Fragment>
  );
}
Actually, we found part of this code in the MUI documentation, which has a section on file upload buttons. This is one of the reasons MUI is such a great library for bootstrapping React projects—you can find tons of examples for different use cases there.
At this point, let us think of the state we need. We want to hold the following data inside the state of the App component:
- The total income
- The total expenses
- The aggregated transactions
The first two items can be just numbers, but for the third one we need to define an interface:
interface Transaction {
  id: number;
  payee: string;
  amount: number;
}
With that being said, we will use the useState hook to initialize the empty state:
const [transactions, setTransactions] = React.useState<Transaction[]>([]);
const [income, setIncome] = React.useState<number>(0);
const [costs, setCosts] = React.useState<number>(0);
Now, let’s complete the upload functionality by writing the logic for the parsing function. To do this, we’ll create a function called handleUpload, which will call the Papaparse parse function:
const handleUpload = (files: FileList | null) => {
    const file = files?.[0];
    if (!file) {
      return;
    }
    Papa.parse(file, {
      complete: function (results: { data: string[][] }) {
        const content = results.data.slice(1);
        const totals: { [key: string]: number } = {};
        let incomeSum = 0;
        let costsSum = 0;
        for (const row of content) {
          const payee = row[0];
          const amount = parseFloat(row[1]);
          if (payee && payee.length && !isNaN(amount)) {
            if (amount < 0) {
              totals[payee] = (totals[payee] || 0) + amount;
              costsSum += amount;
            } else {
              incomeSum += amount;
            }
          }
        }
        const aggregatedTransactions = Object.entries(totals)
          .map(([payee, amount]) => ({
            id: 0,
            payee,
            amount: -amount,
          }))
          .sort((a, b) => b.amount - a.amount);
        for (let i = 0; i < aggregatedTransactions.length; i++) {
          aggregatedTransactions[i].id = i + 1;
        }
        setTransactions(aggregatedTransactions);
        setIncome(incomeSum);
        setCosts(costsSum);
      },
    });
  };
If you are familiar with higher order functions like map, sort and filter, then the above code is easy to understand, if not we recommend reading our last blog post on higher order functions in JavaScript.
The above code does the following steps:
- Takes as an argument a file list from the file input.
- Gives the first file in the list to Papaparse, in order to parse it.
- Papaparse then transforms the CSV rows into string arrays.
- The JavaScript code runs the business logic to aggregate the transactions and computes the balance.
- Finally, all data is saved in the component’s state.
This function should be called from the file input:
<VisuallyHiddenInput
   type="file"
   accept=".csv"
   multiple={false}
   onChange={(event) => handleUpload(event.target.files)}
/>
For the sake of debugging we may add some console logs after we set the state:
setCosts(costsSum);
console.log("Income:", incomeSum);
console.log("Costs:", costsSum);
console.log("Transactions:", aggregatedTransactions);
Run the app to see how it’s working so far. You should see an upload button, and after uploading your CSV file with the transactions, the results should appear in the console window, as shown below.

You may notice that descriptions from the spreadsheet, like “Groceries” or “Gas station,” have been summed together. This allows us to see how much money we’ve spent in total for each reason. The spending reasons can be broken down into specific shops rather than generic categories, like e-banking usually does. If you’d prefer, as an exercise, you can group shops into categories and display your own custom categories instead.
Another, slightly more advanced exercise would be to allow multi-file uploads and concatenate them. This way, you can analyze data from different accounts together.
And talking about display, let’s move on to the next step, which is to display our findings in a nice table.
But first, if you follow along you may want to create a new commit at this point:
$ git add .
$ git commit -m 'Read CSV file'
Display the transactions
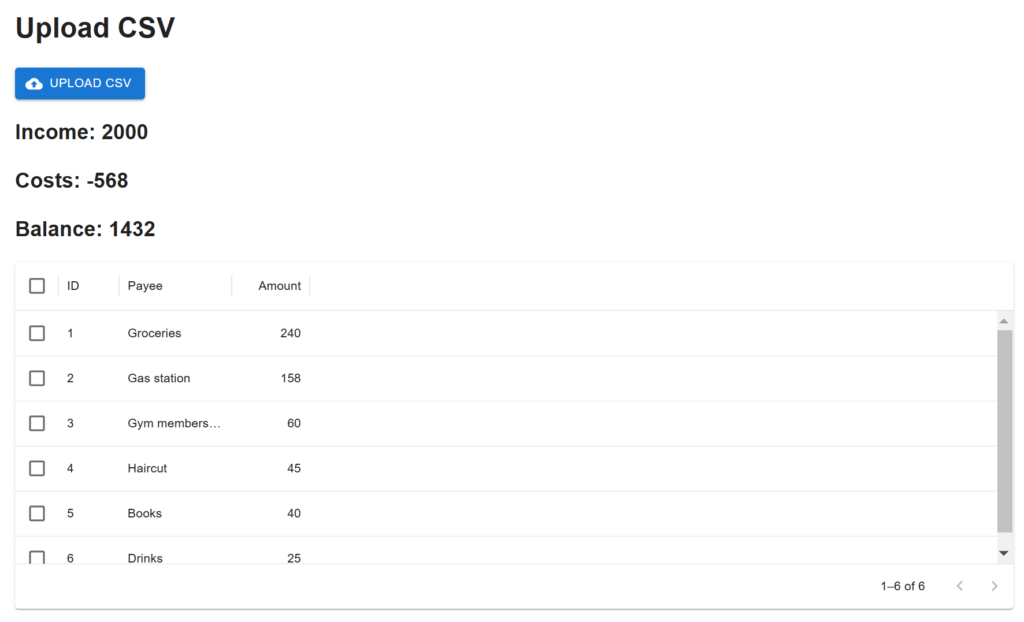
For the table, we’ll use MUI’s Data Grid. This is actually the easiest part, because MUI provides a very user-friendly API. All we need for the table component and the three headers to display the sums is the following code:
<h2>Income: {income}</h2>
<h2>Costs: {costs}</h2>
<h2>Balance: {income - Math.abs(costs)}</h2>
<Paper sx={{ height: 400, width: "100%" }}>
  <DataGrid
    rows={transactions}
    columns={columns}
    initialState={{
      pagination: { paginationModel: { page: 0, pageSize: 50  } },
    }}
    pageSizeOptions={[5, 10]}
    checkboxSelection
    sx={{ border: 0 }}
  />
</Paper>
You may find one example of how to use the data grid component in the MUI documentation, the code there is similar with this one.
The only additional configuration variable we need to define here is the columns definition:
const columns: GridColDef[] = [
  { field: "id", headerName: "ID", width: 70 },
  { field: "payee", headerName: "Payee", width: 130 },
  {
    field: "amount",
    headerName: "Amount",
    type: "number",
    width: 90,
  },
];
We defined an “id” column, even though our initial interface didn’t have one, due to a constraint of the MUI Data Grid that requires an “id” column.
If we now run the app we can see the aggregated data of our transactions in a table and three additional headers with balance data.
Conclusion and final exercise
This may be the end of the blog post. If you followed along, I hope you had fun! You can expand this example into something much more powerful to monitor your expenses like a pro. For example, you could use amCharts to display the expenses in a graph (we might write a tutorial on that in the future, so stay tuned!).
For now here is a nice challenging exercise for you:
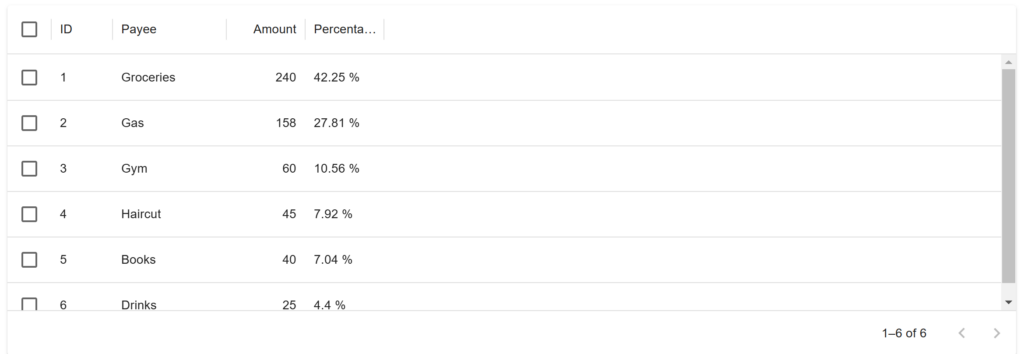
Try adding a third column with the percentage of each expense relative to the total expenses. The final result should look like the table shown in the picture below.
Thanks for reading and happy coding!
